Web Management Reports: New Interface
Go to the new interface at: https://www.more.lib.wi.us/iii/webrpt/app

All Circulation Activity
For regular circ statistics, click All Circulation Activity.
Enter your initials and password and click OK.
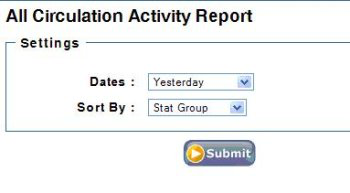
Choose the dates you want the report for. If you want 2 or more months, choose User Specified.
In the Sort by box, choose Limit to get statistics just for your library.
The screen will refresh and now show a Limit by box. Choose Stat Group.
The screen will refresh again with a table of all the stat groups. Check the boxes in front of the numbers for your library.
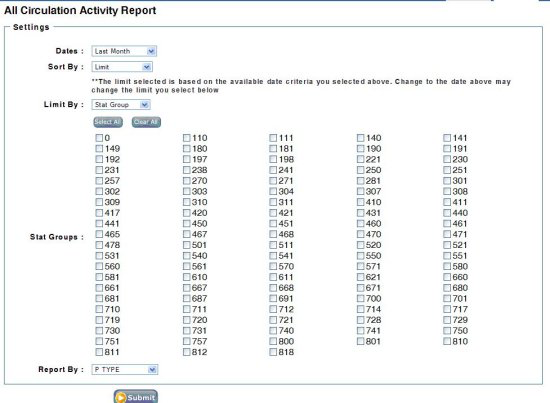
For Report By, choose the way you wish your circulation to be reported:
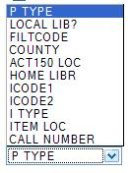
- P Type divides circ by adult, juvenile, Interlibrary Loan, etc.
- Local Lib? Is no longer used.
- Filtcode is the Internet filter code used by some libraries.
- County is by county of residence in the patron record.
- Act150 Loc is by that code in the patron record.
- Home Libr is by Home Library in the patron record.
- ICode 1 is by owning library.
- ICode 2 is by Adult, Juvenile and Young adult.
- I Type is by item type, books, DVDs, audiobooks, etc.
- Item Loc is by item location.
- Call number is by the call number on the item.
Once that is done, click Submit.
One of two things will happen: either you will get a download box asking to save or open the file, or you will see a message at the top of the screen telling you that your report is processing, and to go to the Review tab to view it when it’s finished.
The dialog box for opening or saving will differ depending on the browser you use.
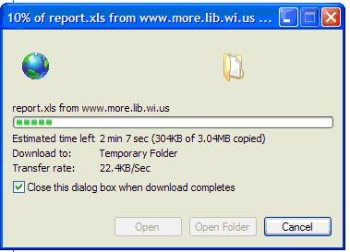
In Firefox:
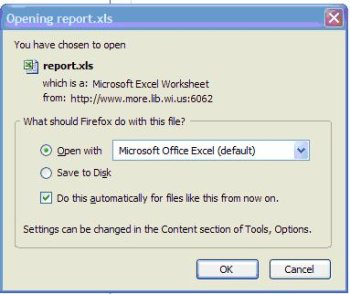
Click OK. Then you will see the download progress:
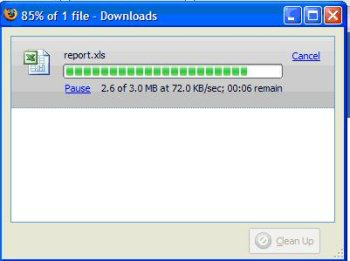
In Internet Explorer:

Click Open, and the download will start:
In either case, your report will open in Excel.
Notice that there are 4 tabs across the bottom.
![]()
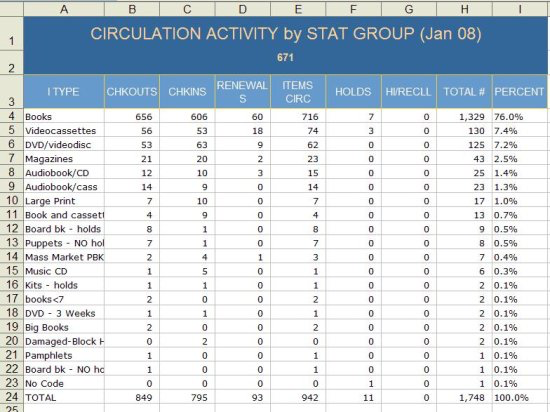
The first one is Table and has a fancy header. You can re-sort this if you like, but don’t do any data manipulation (adding formulas or adding or deleting columns) on this tab as the pre-set settings make it difficult:
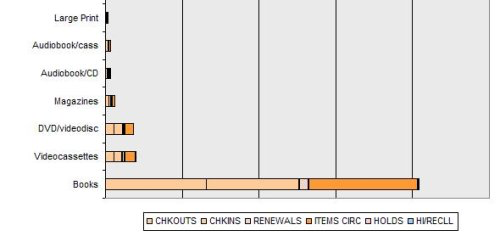
The second tab is the Circulation Activity Chart. It is a nice bar graph showing all the types of activity by the entries in the type of report you choose:
The third tab is the Summary Chart, showing in bar chart format the different types of activity relative to each other:

The last tab is Raw Data. This is where you can manipulate the data in any way you choose. Be aware that any changes you make here will affect the data in the other tabs. If you delete the checkins column, for instance, that will also be deleted from the charts in other tabs:
You can readjust columns to see all the data. You can sort it by any column.
Circ Activity reports start with a sort by total number, which is not necessarily how you want to present the report.
Once you have it the way you want it, save it. It will be saved just like any Excel document. You can have each report readily available in electronic format at any time without having to go back and re-run the report.
Please Note: We can only have 200 reports available in the Review tab of Web Management Reports. Once you have your report safely saved in Excel, please go back to the Review list and delete your report by checking the box in front of it and clicking Delete at either the top or bottom of the screen.
To start another report, go back to the Create tab and make your selections again.
NOTE: if you haven’t left the Create tab, you can just change the Report By selection and click Submit again. If you have switched to the Review tab, when you switch back to the Create tab you will have to start from the beginning.
Cross Tab Reports
To get circulation data on 2 different data elements, use Cross Tab Reports.
Click on Circulation Cross Tabs.
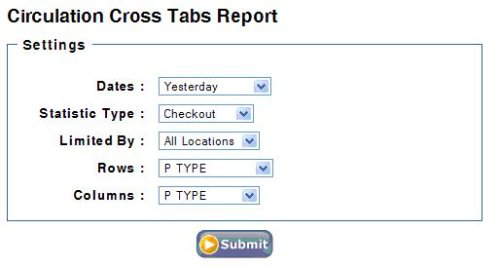
Fill in the desired values.
- Dates are the same as All Circ Activity.
- Statistic Type is Checkout; this includes checkouts and renewals.
- Limited by: Stat Group, for just your library.
Determine which fields you want in your report, and put the field with the most values in Rows and the one with fewer values in Columns.
Click Submit.
Download and open as described above.
Some examples for type of reports to run:
- I type by I code 2 will show you what formats of materials are being checked out according to whether they are adult, juvenile or young adult materials.
- P type by I code 2 will show you what adult and juvenile patrons are checking out by audience level.
- ACT150 by I type will show you the types of materials checked out by each ACT150 location. It could be interesting to see if certain types of materials are being checked out to more rural patrons.
For example:
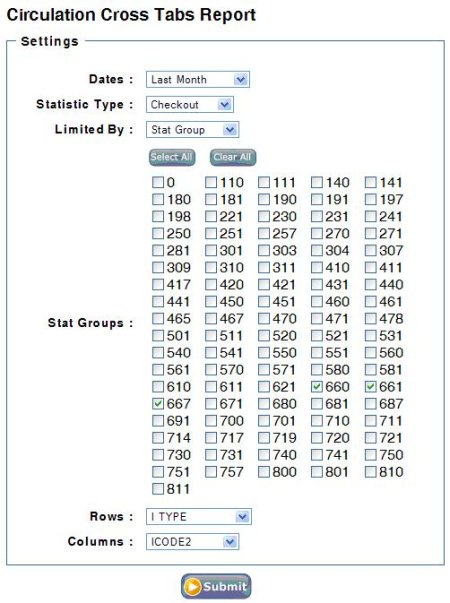
This will generate the following report:

Patron Reports
These are system reports only – you cannot limit to your library.
Display by:
- Patron Type gives you the number of patrons, by patron type, that have items currently checked out, the average number of items per patron, the number of items overdue, the number of patrons with fines and the total amount of those fines, as of the time you run the report.
- Item Type gives you the current number of checked out items by item type with the same information as above.
- Item Location gives you the current number of checked out items by item location, listed in alphabetical order, with the same information on number of overdues and fines.
Checkouts
The information in these reports is for checkouts by location code regardless of where they were checked out. It will show you where your library’s items have been checked out. You can not use these for regular circulation statistics for any legal purpose.
- Dates have the usual choices.
- Locations All locations means for the entire system.
- Separate will list all locations in the system, but group them by location code according to the type of report you choose.
- One Only lets you select your library.
- Special lets you enter up to 10 location codes to get a report on.
- Report by gives you the usual types of reports.
Experiment with the different types of reports to see what information you can get and how you might be able to use it.